Did you know that the Open Hardware Monitor DLL provided with HWMonitor (OpenHardwareMonitorLib.dll) handles all of the heavy lifting within the application and can be used by developers to power C#/.NET/ASP projects with relative ease.
You can simply copy this single file, drop it into your c# project, add a reference and you can start creating system health applications in a few simple steps.

Before we get started, let me introduce myself; I’m Andy, and I shall be your host for the next ten minutes. If you like, you can follow me on Twitter where I post about my journey as a technology writer and a freelance designer & developer.
UPDATE: I wanted to update you all as I am still using this code today. I ended up using the variety of methods available within the Open Hardware Monitor DLL file. The result is a little LED screen that reports my CPU / GPU Temps as well as the current temperatures.
If you are unsure what methods are available or what information you can access, make sure you are using a valid IDE such as Visual Studio Code which will allow you to see all of the methods available. I warn you though; Make sure you have a cup of coffee to hand as there is an extensive amount of methods which access various hardware sensors.
If you struggle with the guide below, leave a comment or send me a tweet at @andy_ppsu
First up, What is HWMonitor?
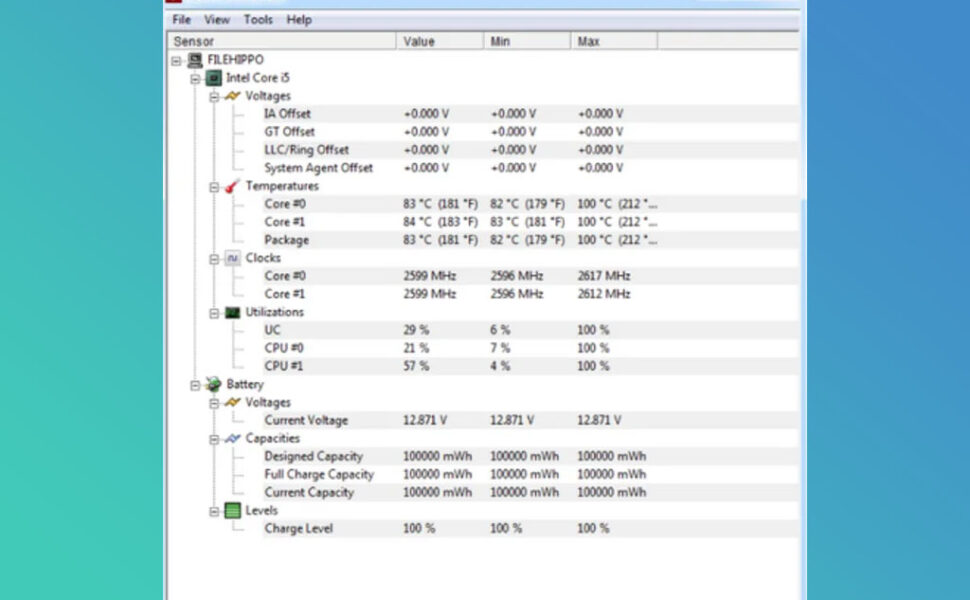
To first understand the Open Hardware Monitor Libray, you first must understand what HWMonitor does. HWMonitor is a system information & system health monitoring software for Windows and Linux. This free system reporting software displays information on a wide range of your computer hardware sensors such as CPU, RAM, GPU, Fans, hard drives and even motherboard.
HWmonitor is arguably one of the most popular utilities available to overclockers, gamers, computer hardware enthusiasts and professional computer technicians and comes with several features that put it a step ahead of the competition for its hardware sensor reporting capabilities.
HWMonitor Key Features
- Trusted within the community
- Support for AMD, Via & Intel Processors
- Support for AMD, ATI & Nvidia GPUs
- Can report frequencies, voltages, temperature and more.
- Constantly updated with fresh hardware support
- Pro version includes additional logging capabilities, remote operation, and graphing. (Not required for this article)
At the core, HWMonitor is getting all of its data from the OpenHardwareMonitorLib.dll which is included within the directory of the downloaded files. This single file is responsible for all of the system health statistics and system information reported within the program – lucky for us, we can take the DLL and use it in our own projects.
HWMonitor is available for everyone to download from the CPUID download page with no strings attached.
What System Information can I access using OpenHardwareMonitorLib.dll?
Now that you understand HWMonitor and what its purpose is, you might be left with a question: what can you do with the Open Hardware Monitor DLL, and what information does it expose? Here is everything I could find.
| # | Hardware | Information Available |
|---|---|---|
| 1 | CPU | Bus Speed, Frequency, Usage, Temperature, Power Draw |
| 2 | GPU | Core Frequency, Memory Frequency, GPU Usage, Temperature |
| 3 | RAM | Ram usage |
| 4 | Motherboard | Vcore, DRAM voltage, System Temperature, CPU Temperature |
| 5 | Hard Drives | S.M.A.R.T, SSD Wear Level, Read/Write |
| 6 | Fans | Fan Speed |
For this article, I will be focusing on fetching the CPU and GPU information, storing them in variables and outputting the values to the console. If you need more stats such as motherboard or ram, you can use the same methods to access any other system information you wish.
Integrating the HWMonitor DLL with Visual Studio / C#
Before you can query the DLL and start fetching information in your C# code, you need to go through some basic project set up to ensure you can access Open Hardware Monitor from within your project.
Below is an overview of the steps required.
Steps Required
- Download Visual Studio
- Open Visual Studio
- Start a New C# Project
- Extract OpenHardwareMonitorLib.dll
- Add DLL to Visual Studio Project
- Force your app to run in administrator mode
Shall we get started?
1. Download Visual Studio
Head over to the Visual Studio website and download the relevant version. I am using MAC for programming atm so I downloaded that one.
2. Install & Open Visual Studio

Once you have downloaded Visual Studio, go ahead and open the file to start the installation. Once complete go ahead and open the program.
3. Start a New C# Project
Before you can start writing any code or interacting with HWMonitor, you need to set up a new project.
Follow these simple steps to get started:
- Click new
- Select console project
- After, select .net framework 5.0
- Give your project a unique name
- Enable GIT if you need version control
- Click the create button

4. Extract OpenHardwareMonitorLib.dll
With your C# project set up and ready to go, you need to extract the required file and pull it into your project. To do this, download HWMonitor, open the zip and move OpenHardwareMonitorLib.dll into your new c# project folder.
5. Add DLL to Visual Studio Project

To start fetching the system information in our code, you need to add the DLL file reference to your visual studio c# project.
Here is what you need to do:
- Click Project > Add Reference
- Select the .net assembly tab, click Browse
- Navigate to and select the copy of OpenHardwareMonitorLib.dll that you placed in your project folder
- Hit ok
These critical steps ensure you have added the required DLL file to the project and that you can now reference it in your project’s files. To find out how to probe your system and pull essential information such as CPU frequency, load and voltage, move on to the next step below, which outlines some practical examples.
6. Force your app to run in administrator mode
To access system-level information, you need to complete one final step designed to enable administrator access at startup.
UPDATE: I was made aware that some of you was struggling to see what to change your tag to. I have updated the code below so that you can correctly change your tag when forcing your app to run in administrator mode.
- From the project panel, right click Project > Add New and click Application Manifest File
- Press Ctrl + Shift + F and search for “requestedExecutionLevel”
- Change the tag to:
<requestedExecutionLevel level="requireAdministrator" uiAccess="false" />
Failure to complete these final steps will result in blank data being returned from OpenHardwareMonitorLib.dll. Unfortunately, I made this mistake in my project and spent ages debugging it.
Example Code: OpenHardwareMonitorLib.dll and C#
The above example will get you up and going with an actual application that grabs information about your computer’s CPU and GPU and outputs them to a simple console app. If you want, you can grab this code via the Gist.
Before you can use this example code, you will need to set up a new project which I outlined in the previous step.
Breaking down the Code

The above code is an excellent copy and paste example for experienced developers who know their way around but, for those of you with a little less programming experience, this section was made for you.
I will break down the example code and show you step by step how everything is working.
1. Include a Reference to the DLL
To start and, before you can access the hardware reports you need, you will first need to include a reference to the DLL at the top of your project main file right after the other using statements.
This line of code will enable Visual Studio to access the functionality we need in further steps. Let us move on.
2. Defining the Hardware to Report
To start grabbing pc health stats, we need to define a new computer object exposed by the Open Hardware Monitor DLL. Everything we need is held within the computer object, and it is also where we define which hardware we want pc health stats reported for.
You will notice two settings within our new computer object; GPUEnabled = true and CPUEnabled = true. These settings tell the Open Hardware Monitor library to return data for any processors or graphics cards currently connected to the system. If we don’t define them here, we won’t have any data within the loop.
In case you are wondering, here is a list of the options available to the object: new Computer(){}.
Full List of Hardware Reports Available
- GPUEnabled – Enable GPU related statistics and reports
- CPUEnabled – Enable CPU related statistics and reports
- RAMEnabled – Enable RAM related statistics and reports
- MainboardEnabled – Enable Motherboard related statistics and reports
- FanControllerEnabled – Enable Fan related statistics and reports
- HDDEnabled – Enable Hard Drive related statistics and reports
Now, considering we have defined the computer object, we need to start a connection between your code and the DLL file.
This single line will startup the DLL and enable it to start fetching pc health status.
3. The Loop
The loop is where the magic happens and is called every second by the Main method located at the bottom of the file. This loop makes a call to ReportSystemInfo(), which goes through all the available data and returns only the information we have requested.
As you can see, methods are relatively straight forward and it’s as simple as targeting the correct Sensor Type and Sensor Name.
4. Accessing CPU Information
Inside the loop, there are two distinct sections covering CPU information and the other covering the GPU. Here we will look specifically at the CPU.
5. Accessing GPU Information
After the CPU section, you will find one more section covering system information for both Nvidia and AMD GPUs. The Open Hardware Monitor library reports information for both separately, so we need to access them in their unique way.
Conclusion
This has been quite a lengthy tutorial. If you followed along and managed to get everything working, pat yourself on the back.
The Open Hardware Library enables .net and c# developers to interface with system hardware and fetch key information on a range of hardware sensors. This method could pave the way for unique applications that are decoupled from the HWMonitor UI. This will enable developers such as yourself to easily create their system health monitors and pc health status monitors.


")
Thank you sm! It’s very helpful.
“6. Force your app to run in administrator mode
To access system-level information, you need to complete one final step designed to enable administrator access at startup.
From the project panel, right click Project > Add New and click Application Manifest File
Press Ctrl + Shift + F and search for “requestedExecutionLevel”
Change the tag to: ”
What do you change the tag to?
I have updated the code of the article Kurt to reflect the tag you need to set. It seems some browsers were not processing it correctly and it was not displaying. All fixed now!
hello Andy Cresswell would like to know if you have any project with the open hardware monitor library, it makes it very difficult for me to use the library and I need it for a project, the code you show me only shows me cpuUsage, greetings
You can use an IDE such as VisualStudio to check all of the available methods and parameters you can use.
Andy, this is an excellent tutorial.
Alas I have been unable to get this code to work, nor any other examples on the web which try to access OpenHardwareMonitor. I think the issue may be Net6/VisualStudio 2022 related
I get an error message at the line c.Open
System.MissingMethodException: ‘Method not found: ‘System.Threading.Mutex System.Threading.Mutex.OpenExisting(System.String, System.Security.AccessControl.MutexRights)’.’
This suggests to me that the latest implementation of “System” within VisualStudio no longer has an “open” method. The attached link led me to conclude that this is an implementation issue but you may be better equipped to diagnose
This is a new one for me, Grant. I cannot personally say that I had faced this when getting setup.
Sorry I could not have been of more help.
sorry missed this
https://github.com/dotnet/runtime/issues/45895